Presented by: The Sheep of Yore
MAPPING MEDIEVAL MANUSCRIPTS
For my midterm project, I decided to explore the Oxford Library’s collection of medieval manuscripts in order to map where manuscripts in the collection are from and what subjects different countries focus on. My goal was to create an interactive map that could showcase the most common manuscript types for each country.
DATA CLEANING
My data set was very large with each row equating to a manuscript and each column a different measurement of that manuscript. Some of the columns included binding details, previous owners of the manuscript, and the title of the work. Because of this, much of the time I spent working on this project was spent through data cleaning. After deleting the columns I wasn’t going to use, I then went through and deleted any rows without a country of origin listed or with multiple or non-definite origin points. I also deleted any entries without document types listed.
Another large portion of my time was spent on identifying which subject each manuscript primarily covered. Although this was a column listed within the dataset, I found it necessary to go through and make edits as the process they used at identifying the different subjects was not standardized. I sorted my sheet alphabetically by country name and changed all past countries (Byzantine Empire, Dalmatia, etc.) to the modern countries where their capitols are/were located.
GRAPHING
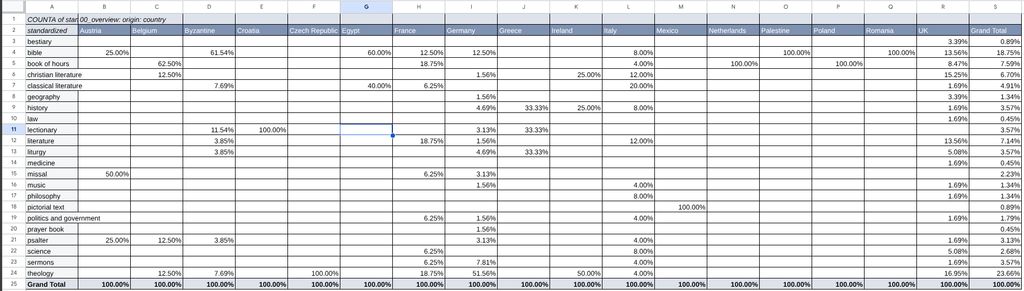
Once my data had been cleaned, I created a pivot table in Google Sheets in order to see which subjects appeared across each country’s collection. After creating my pivot table, I uploaded it into Flourish and created a pie chart for each country.
MAPPING
While creating my graphs, I also worked on adding my data to an ArcGIS map. I used feature layers of each country from the Living Atlas and color coded them based on what manuscript type took up the largest percentage of their collection. I was hoping to eventually create a legend to explain what each color corresponded to, but couldn’t find an elegant way to do so.
Actually creating the ArcGIS map was fairly simple and didn’t take me too long to do. There was no pre-made layer of Palestine, so I ended up creating a polygon sketch there. The Byzantine Empire became Turkiye after I decided that it would be too complicated and time consuming to do the same for such a large country. Scotland’s one entry merged with England to create the UK for the same reason.
After finishing the map in ArcGIS, I created an Exhibit Instant App, imported bookmarks (basically saved places. For my project these were views of each country), added an exhibit block to the bottom right corner, added screenshots of each pie chart to the corresponding country, added an introductory message, and published the map. I embedded it into this site without issue as an iFrame and edited the HTML code to change its size.
It sounds streamlined now, but it took me hours to find the kind of instant app I was looking for and I tried so many solutions that didn’t end up working before trying the Exhibit app. This was the most frustrating part of my project and something I couldn’t find an answer for online.
IMPROVEMENTS
I honestly wish I had more time to spend on this project so that it could turn out how I had originally envisioned, but technological difficulties, other homework, and a migraine inevitably cut the process a little shorter than I had intended. Because I am not a medieval historian, going through the dataset was also very difficult and I definitely cut data that, if I had more time and knowledge, I would have liked to keep.
In terms of the graphs and map, I have a few more issues. One, the graphs are not at all big enough to reasonably read and I couldn’t find a way to make them bigger. Two, there is no legend which makes the colors appear arbitrary. Three, I don’t list how many manuscripts are in each country’s collection which means that it is impossible for viewers to know if Mexico has two pictorial texts (the correct answer) or twenty. Four, combining countries and adapting historical countries is problematic. And five, because the images of my pie charts are screenshots, they are static and thus can’t be interacted with like I had planned.
CONCLUSION
Overall, I think this was a cool project and something that does have potential, just not in the time I had available to me. It could be made into a much better map by people with more experience with ArcGIS and web mapping and by people with more knowledge of medieval manuscripts than I have.
I understand now why people don’t choose this data set, but I’m glad I did. I love books and I’ve been able to flip through medieval manuscripts at Indiana University’s Lilly University for several years which made this project feel personal. I’ve seen and touched several books of hours, appreciating the carefully illuminated pages each time. I wish I could have delved deeper into the history of these manuscripts because I know it would be fascinating and something I would have deeply enjoyed.